The indie hackers guide to building your SaaS cashflow forecast
July 22, 2021
As a bootstrapped startup, cashflow is one of the more important metrics you need to keep an eye on. Not just because you actually need that cash to keep everything running (though this is important). If you're growing, you want to know what's available to re-invest and how many new people can you hire? For us here at Prezly, running this forecast allows us to make sure our hiring plans are feasible and gives us enough of an edge to hire pretty close to what comes in.
But the biggest benefit we've experienced is even a lot simpler: peace of mind. We're a small company with no investors, no board, no financial advisor, no CFO, so before we built this out, we constantly felt we were winging it simply by looking at our bank account. Now, we feel we're in control and can simulate what a decision we take today could mean in 5 months or 2 years.
Getting Started
The great thing about a SaaS business is that you can actually predict your cashflow pretty accurately because, in most cases, both growth and churn are relatively stable. But it's not as simple as counting on your MRR to hit your bank account every month either unless you're only doing monthly billing.
For example, at Prezly, most subscriptions get charged annually (65%), so in those cases, the money comes in at pretty irregular times. We have some months with a lot of yearly renewals, and some have a bit less. Yet, at the same time, our costs remain mostly stable month-over-month. So, the whole idea is to use this forecast to make sure you're on top of your cashflow and have an idea —albeit rough— of what will be in your bank account in a given month in the future and how to set your budgets for hiring, advertising, etc.
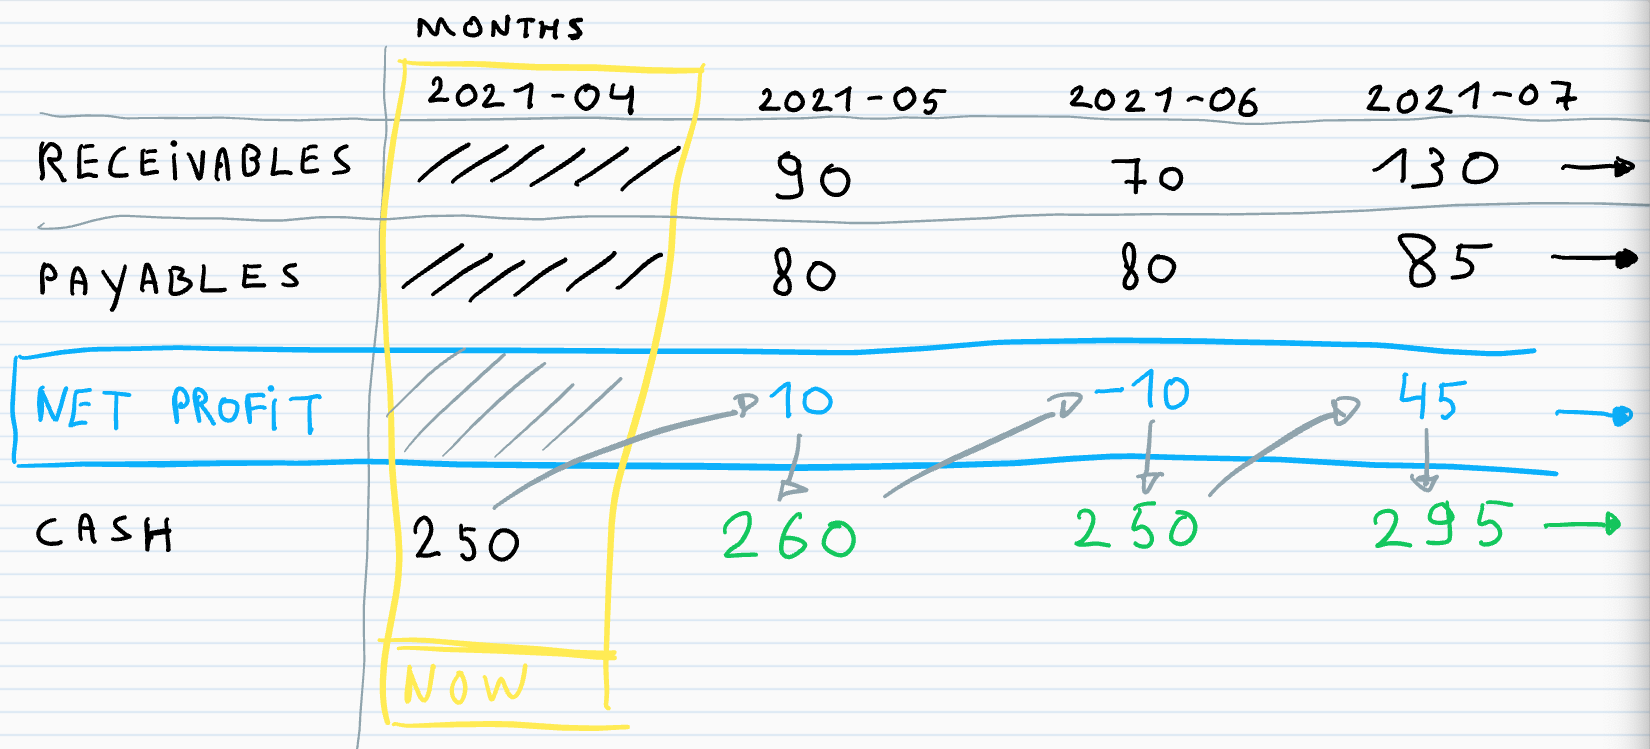
Let's split things up into receivables, payables, net profit, and cash, and start collecting all these details normalized to a given month. The goal here is to plot these 3 numbers in different rows (or columns, depending on how you like to work) and plot them over time, resulting in a spreadsheet similar to what I sketched here:
- Receivables: What you're planning to receive in a future month
- Payables: What you're planning to pay in a future month
- Net Profit: Receivables minus Payables in a given month
- Cash: What you have in your bank account this month
Disclaimer: I'm not an accountant nor a financial expert. Our forecast model gives us rough estimates and is something that needs to be reviewed regularly. Also, keep a good fault margin into account while looking at your forecasted cashflow. We're trying to predict the future, which isn't possible.
Receivables
Here we'd like to estimate what we're planning to receive in a future month. Even with something as stable as a subscription business, it can be tricky to predict and probably the hardest number to get in this forecast. This is due to inconsistent billing periods, different renewal dates, currency conversion, upgrades, downgrades, churn, and new signups. So you can make this as complex as you'd like, but at a very basic level it is based on:
renewing subscriptions + new subscriptions
- Renewing subscriptions: For all existing subscriptions that are planned to be renewed (so excluding churning subscriptions) in a given month, the actual revenue will be based on the price of their subscription and billing cycle. Depending on your growth rate and size, this will probably be your most stable number, so it's important to get this right. If you'd like to make a very conservative forecast of your cashflow you could even opt to not take growth into account.
- New revenue: This can be an expansion from existing subscriptions or can come from completely new customers. It's probably helpful to look at your historical growth rate, calculate your new revenue based on a growth percentage that makes sense, and regularly review it. At the bottom of this article, I'll link a fancy tool in which you can make this a variable that you can easily change or even run multiple scenarios based on different growth variables.
This means once we have the renewing revenue number of a given month, we could calculate both the new revenue as well as churned revenue as a percentage based on that number.
At Prezly, we're using Stripe, so all of our subscription data is nicely stored in there. This means we can use their API to build our future receivables. In our case, we're running a node.js script that loops over our active subscriptions and creates records for future invoices in an Airtable:
- Select all your active subscriptions (active and past_due) and loop over each subscription.
- For each subscription, check if it is set to cancel and skip the subscription if it's scheduled to cancel. We don't want to create invoices from subscriptions that we already know will cancel.
- Depending on how far in the future you'd like to forecast, create a variable that has the number of times a future invoice needs to be generated. For example, if you'd like to forecast 2 years into the future and the billing of the subscription is monthly, the repeats variable needs to be 24. For a yearly subscription, it needs to be 2.
- For the number of repeats, create and store the future invoice with the correct cursorfuture_invoice_date and the amount of the invoice (billing_interval* MRR)
- It can be helpful to add a separate amount field for tax on a given invoice, so you're able to split that out easily as well.
- It can be helpful to add a separate amount field for tax on a given invoice, so you're able to split that out easily as well.
- Once you've stored all those future invoices in Airtable, group these invoices by month and you'll be able to see what you're planning to invoice in a given month in the future.
Payables
Compared to Receivables, your Payables should be easier to predict and usually a bit more stable as well. We're fans of keeping most of our costs monthly. It's often a bit more expensive than signing up for a year, but it has advantages concerning cashflow and flexibility. Some of our costs are yearly, quarterly, or more ad-hoc (travel costs or conferences), so we do try to normalize those non-monthly costs to a monthly budget. We realize we make some shortcuts by bringing everything to a monthly budget, but for simplicity reasons, it does save a lot of headaches. So, what's in our Payables:
- Monthly fee for all services and employees, optionally with tax split out. My co-founder Gijs wrote something about the cost of running a SaaS, check out his blogpost.
- For more variable costs like advertising, we agree on a monthly budget, and that budget is what we set as monthly fee and it is the maximum a team can spend on that service.
- Team(s) to which these costs are attributed.
- Start and (optional) end date of the cost.
The whole goal of this exercise is that you're able to get to a projected monthly cost. This is an important number since with everything you know now, this is what you'll be spending in the coming months.
There are multiple ways to bring all of this together. We use a spreadsheet with a few tabs (Airtable) to collect all those details (some things are collected manually, others come in automatically). We have a few sheets related to Costs:
- People: all of our active employees with full monthly costs
- Costs: all of the tools we use with their monthly cost/budget
Based on this number you'll be able to easily run scenarios like:
- What's the impact on my cashflow if I hire 2 people next month at x/month?
Absolutely crucial for a bootstrapped company that is focused on reinvesting profits back into the product. Of course, you don't want to run out of money, but you also want to make sure you keep investing in your product, marketing, etc. - What's the impact on my cashflow if I cut our advertising budget in half or cancel the subscription to this tool?
Pretty rewarding to see how much money you can save in the long term if you'd cut some non-essential tools.
Cash
This is the cash we have in our bank account in a future month. You only need to know the start value, as that's the cash you have this month. The future value will be calculated based on this number and the future month's net profit. Our starting value of cash for the current month is based on the following 2 amounts:
- The total amount of money currently in our bank accounts.
- The total amount of open invoices: invoices that were sent to the customers but not paid yet. Whenever a renewal is handled in Stripe, the subscription renewal date is pushed to the future and the invoice is generated. It's true that you're not always certain if these invoices will be paid, but since we've got a low number of invoices that are uncollectible, we're happy to ignore this.
Bringing it all together
We bring both the Payables and Receivables together in a sheet we call Key Business Metrics. This sheet is an overview of previous and future months. We manually fill in all important numbers at the end of every month. Some are related to running this forecast (projected monthly costs, projected invoices total), but we also use this to store other business metrics like MRR, churn rate, total customers, etc. This gives us a nice historical overview of how our numbers are evolving. I realize this is a bit of a manual process, but I found that filling in the data actually helps you be on top of the numbers as well.
Now that we have all the numbers, we'd like to start forecasting how much cash we have available in a given month after all Receivables and Payables have been paid. For this, we need to have 2 simple formulas that allow us to make a fairly accurate estimation of our bank balance in a given future month:
- net_profit = SUM(future_invoice) - projected_monthly_cost
How much is left in any given month after costs? Net profit can be negative in certain months when you have more costs than income. - bank = net_profit + (bank-n)
How much is in our bank account after we added what was left in the previous month?
Tools
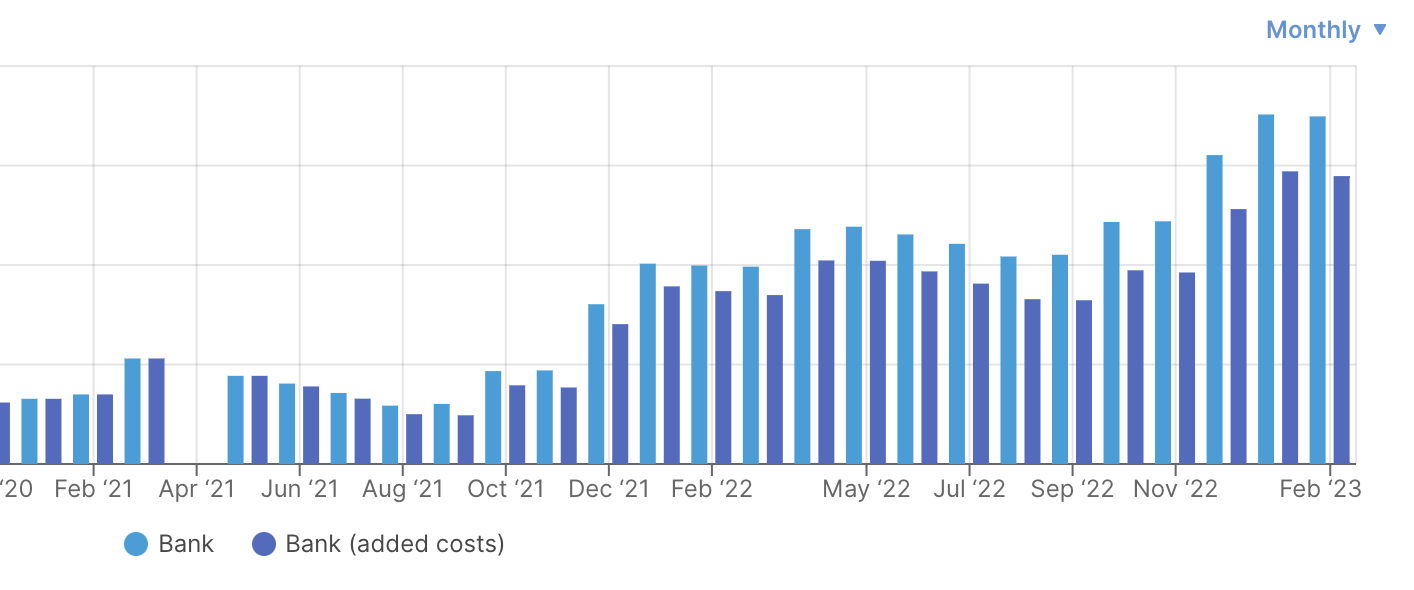
Apart from a spreadsheet (we use Airtable, but Google Sheets or Excel works just as well), you don't really need additional tools. But with this dataset, it becomes so easy to start using more fancy things. We use Causal to graph our progress, run the forecast, and build out multiple scenarios (hiring plan, higher growth, etc.). It gets all the data out of our spreadsheet and can run forecasts with different scenarios based on different variables: different growth rates, different churn rates, and hiring plans. Pretty neat!
Build in checks
If you're planning to use this forecast to help you in making decisions in regards to team, advertising budget, etc., you need to make sure that the numbers you see in the forecast will be reasonably correct, and take a healthy fault margin into account. This is how we deal with it:
- We compare our forecasted numbers with our actual numbers as time passes. Let's say we projected our monthly cost to be 85. After the month finishes, we look at our accounting program and check what we actually spend. So comparing your forecasted numbers with your P&L and making sure the numbers are relatively simple (or you have a good explanation of why they are not) should give you confidence in the forecast.
- Figure out a good process to keep your numbers up-to-date. Sometimes your team changes, your cost structure changes, budgets are cut or raised. Make sure you have a process to update those numbers so the changes get reflected in the forecast.
- Do a longer financial review at regular times (we do quarterly). After every quarter we take a deeper look at all the numbers, evaluate them, and make plans going forward.
Wrapping up
You can build a forecast that is extremely detailed or very high-level. My suggestion would be to not go too detailed and start with a model that is easy to update and easy to understand. Look at the numbers at least once a month and see how they're actually helping you provide guidance during your decision-making. The value of having such a model is that it should reinforce your decision-making, if it's not doing that, it's just a bunch of numbers of a sheet. So don't try to get this perfect on the first take, start simple and more importantly, just start working with it.
Thanks for proofreading Gijs (my co-founder at Prezly) and Taimur from Causal.